RANKX in DAX: How to include Your Company even when they are not in top 5

My customer wanted to see the top 5 providers of a service in a Power BI Report. I added a RANKX calculation to the model.

RANK =rankx(all(Sales[Organization Name]),sum(Sales[Volume]),,DESC,Skip)


Here any filtering is removed to get all sales Organizations, then the sum of the Volume is used to rank the Organizations in descending order.  The Skip will skip ranks on ties.  So if two Organizations are ranked 3rd, then the next organization will be ranked 5th (skipping 4th).

Organization Rank Sum of Volume
Org A 1 10,000,000
Org B 2 9,000,000
Org C 3 8,000,000
Org D 3 8,000,000
Org E 5 6,000,000
Org F 6 5,000,000
Org G 7 4,000,000
Org H 8 3,000,000
Org I 9 2,000,000
Org J 10 1,000,000
Org K 11 500,000
Org X 12 200,000


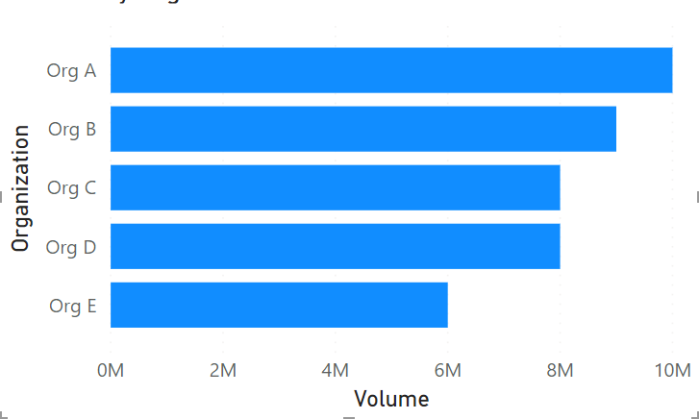
In Power BI we can add a filter to the display to show just the top 5 organizations.

top5

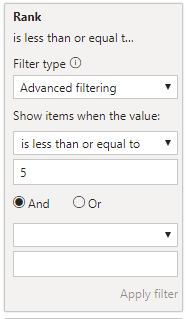
The filter is a shown below.

filterrankx

Including Our Company

My customer liked this but they had one more request.  The wanted to always see our company so they could compare.  Our company is Org X.  In the example we are ranked 11th in this market.  So how do you include us?

I came up with the following solution.

RankwithOrgX:=SWITCH(FIRSTNONBLANK(Sales[Organization Name],sum(Sales[Volume])),”Org X”,0,[Rank])

I use the FIRSTNONBLANK function to find our organization “Org X”.   Using the switch function, I place a zero value for our Organization.  For all other Organizations I use the value from the Rank calculation.

Organization Rank RankwithOrgX Volume
Org A 1 1 10,000,000
Org B 2 2 9,000,000
Org C 3 3 8,000,000
Org D 3 3 8,000,000
Org E 5 5 6,000,000
Org F 6 6 5,000,000
Org G 7 7 4,000,000
Org H 8 8 3,000,000
Org I 9 9 2,000,000
Org J 10 10 1,000,000
Org K 11 11 500,000
Org X 12 0 200,000

Org X shows as 0 under RankwithOrgX.

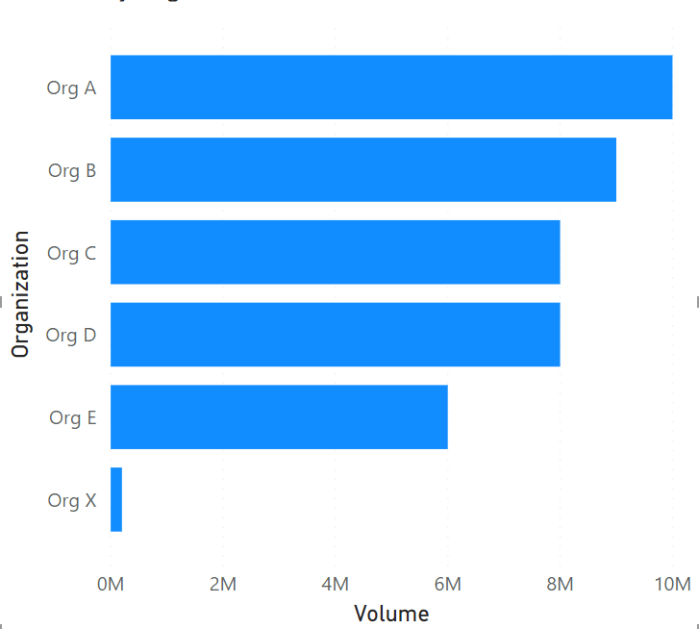
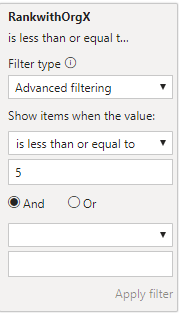
Now if we filter on RankwithOrgX less than or equal to 5. (remove our previous Rank filter)

filterwithorgx

Now our chart will include Our Company no matter its Rank.

Top5withOrgX


Advertisement

How can one Map Census Block Data in Microsoft Excel Power Map?

The census contains a wealth of demographic data down to a very small portion of a county called a census block.  It also contains data at the zip code level as well.  Power Map can map zip codes.  Unfortunately zip codes cross county boundaries, so data can’t easily be rolled up to the county level.  It would be nice if Power Map could recognize census block data geographically.

Power Map does support Latitude and Longitude.  If we could translate the block level data to a latitude and longitude than we could map the data.  After much searching of the Census website I was able to find a source for the latitude and longitudes of the blocks based on centers of population.

If you go to the Geography Reference page on the census.gov web site you will find listed Centers of Population.

https://www.census.gov/geo/reference/centersofpop.html

Centers of Population 1

Click on Data Files and select Centers of Population by Block group.  You have to select a state.  I picked Florida.

Centers of Population 2

This will open up a text file that contains comma delimited data in the format shown below.

Centers of Population 3

We can now use this data to map the census blocks.  Save the data to a file on your hard drive.  Use the From File option in Power Query and

select either CSV or text file and load the data.  It will load without headers.

Census Block Power BI 2

Rename the columns.

Census Block Power BI 4

Add a new Column for GeoCode.   It is basically a combination of the state, county, tract and Block codes.

Census Block Power BI 5

This identifier will match the identifier used in the census data files.  Convert all columns to numbers.

Census Block Power BI 6

Close and Load this data.  Now go to insert a map.

Census Block Power Map 1

Launch Power Map.  The Data will load and recognize the latitude and longitude.

Census Block Power Map 2

Select next at the bottom right and then check population.  Tilt down to see the population.

Census Block Power Map 3

The data is now available to tie to other census data.  Below is an example where I tied in the level of education for the Duval County, Clay County, and St John County. The map is showing the number of people with college educations, bachelor degree or higher.

Census Block Power Map 4